
Hello!
This time we’ll talk about charts. You can find it in datasheets of electronic components, or articles etc.. They are usually understandable, but you can have problem if point of your interest is not in the grid. Why? Try to guess what coordinates x and y have marked point on below chart.
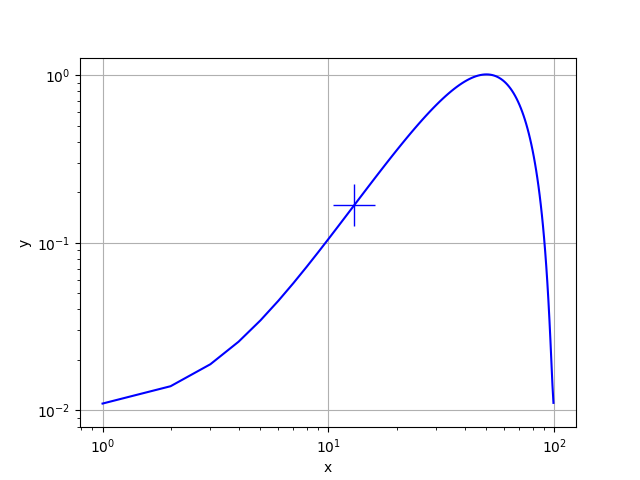 I made it as difficult as it can be, but I often saw this kind of chart in some articles. There’s not much grid in chart, and also both scales are logarithmic. Well if you say that x coordinate somewhere is between 10 and 20, and y is somewhere between 0.1 and 0.2 then you are right… but not too precise. If your knowledge about logarithmic scale is really good, then you can actually guess that x is about 13 and y is about 0.16. But if you ask me, I’m never sure about precision of that guess. I know that if I take two points, like 10 and 100, then right in the middle of the scale will be
\( \sqrt{10} = 3.162… \)
but that’s all i can guess without really calculating. Sometimes there’s no need to have better precision… but sometimes there is. What to do then?
You can use my Charter tool!
Short manual how it works:
If you run it, it will show as tray icon. If you have opened some datasheet or other document with chart, then you can double click on that tray icon to capture your screen. If you have many screens, then you can switch it by pressing ‘s’ key. Now you can mark X and Y axis, and set axis values at beginning and end of each axis. You can set if any of axis is logarithmic or linear. If both axes are set, then you can just double click at any point of chart and it will show coordinates of your double click.
Here you have some small presentation:
More instructions are on Charter page in tools menu on the left.