
During product development there are a lot of moments when we want to check execution time of some piece of code. There are various methods which can be used to that purpose.
On last Embedded World conference I saw on IAR Systems presentation something called “timeline”. It’s new feature of IAR Embedded Workbench.
I never used this IDE, but after seeing this presentation I decided to give it a try.
In this note I’ll show you how it works on. During this tests I used:
- IAR Embedded Workbench version 8.32.3
- STM32CubeMX version 5.2.0
- NUCLEO-L476RG board
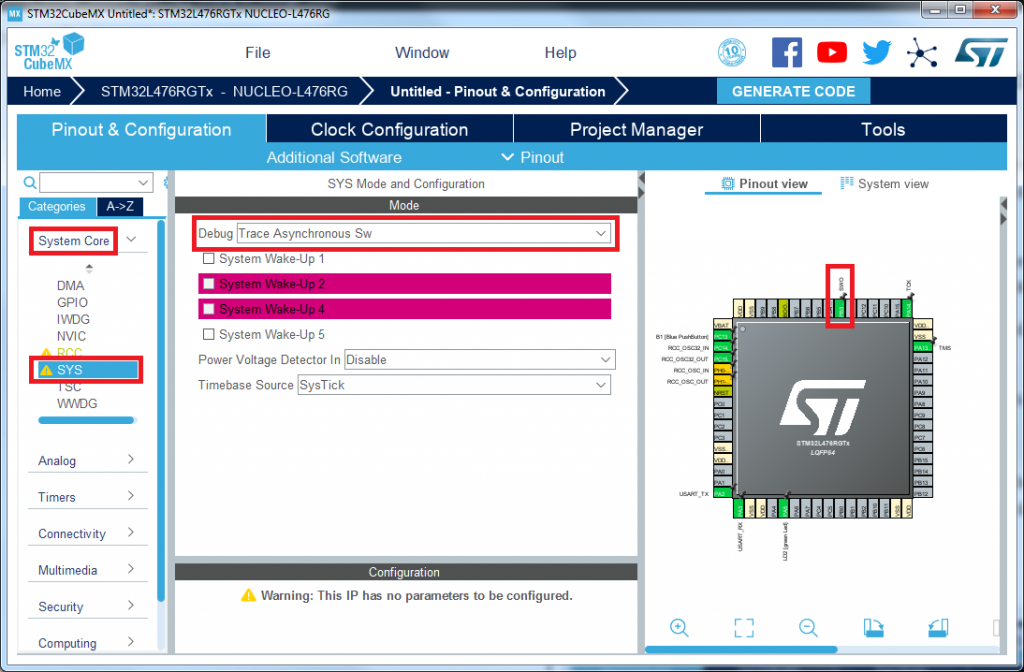
I created a project which works with this board using STM32CubeMx using the standard project for this board with all peripherals in their default mode. Before generation code I only changed debug interface to “Trace Asynchronous SW”.
Now we need to add function to send some data through ITM channel. I placed it in “user code 0” section of generated main.c file.
/* USER CODE BEGIN 0 */
__STATIC_INLINE void ITM_SendMsg(uint32_t ch)
{
   // Wait until last data is sent (through ITM channel 1)
   while (ITM->PORT[1U].u32 == 0UL)
   {
     __NOP();
   }
   // Send data through ITM channel 1
   ITM->PORT[1U].u32 = ch;
}
/* USER CODE END 0 */
Now we can use this function to send some packets through ITM port 1, for marking the timestamps. This function sends one integer value through ITM port 1 (ITM->PORT[1U]). There are 32 ports, but only 1 – 4 works for timeline feature.
Now we are prepared to make some measurements. Let’s write come code.
First of all, I wanted to check if time measurements are not totally wrong, so I decided to write in while(true) loop code, that will send ITM message each 100 ms.
   /* USER CODE BEGIN WHILE */
   uint32_t i = 0;
   while (1)
   {
      /* USER CODE END WHILE */

      /* USER CODE BEGIN 3 */
      HAL_Delay(100);
      ITM_SendMsg(i);
   }
   /* USER CODE END 3 */
Now we can build and run the project. Timeline feature uses SWO pin to get the data, so before we show this window, let’s set up the SWO properly. Click on ST-Link menu and then SWO Configuration and set everything as it is on picture below.
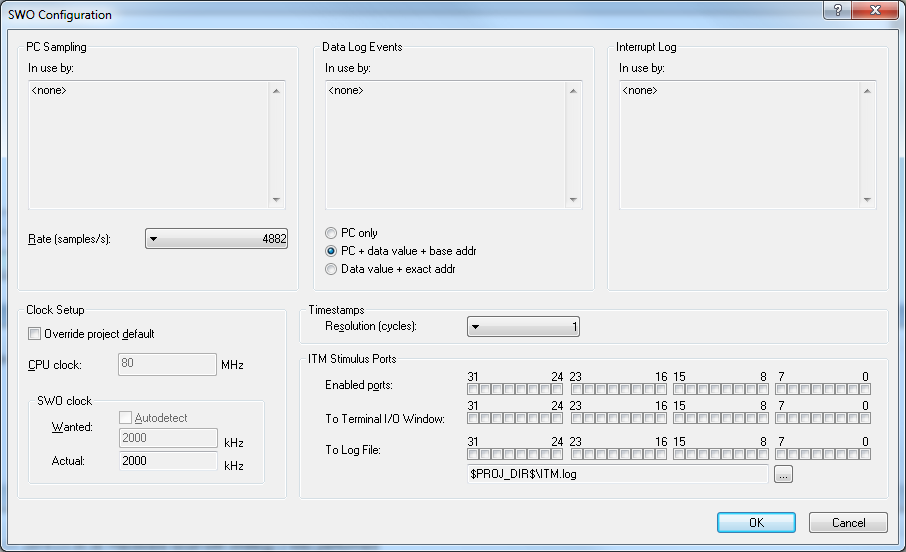
All ITM ports are disabled for now, but it will be enabled when we enable id on Timeline window,
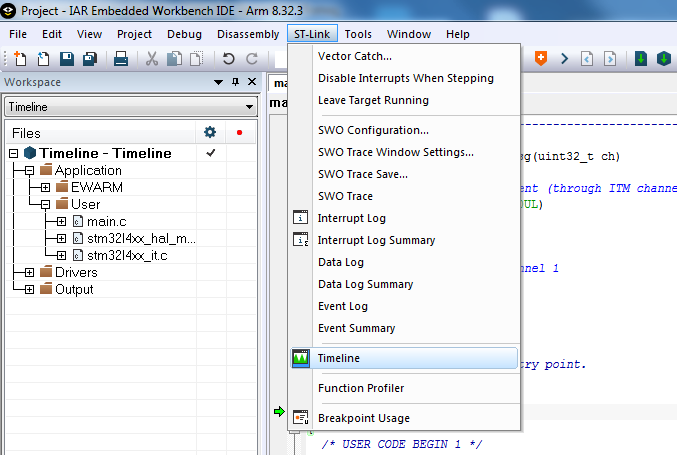
After running the project you have to show Timeline window, using menu ST-Link -> Timeline.
All channels in Timeline window are disabled, so right click on Events channel and enable it. If you do it when the program is already running, then you have to pause (break button  ) it and run it again (Go button
  ) (I think it’s a IAR bug). At this point the Timeline feature should start working, and you should see something like this:
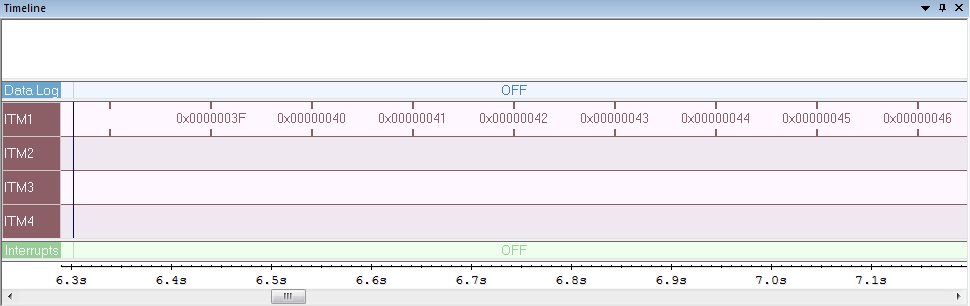
As you can see, values that we are sending through ITM port 1 is visible on ITM1 row. To control the time axis you can use buttons:
- + key – zoom in
- – key – zoom out
- ENTER – zooms the marked range (you can mark the range with mouse)
If you want to manipulate or measure time in Timeline, I recommend pressing pause button.
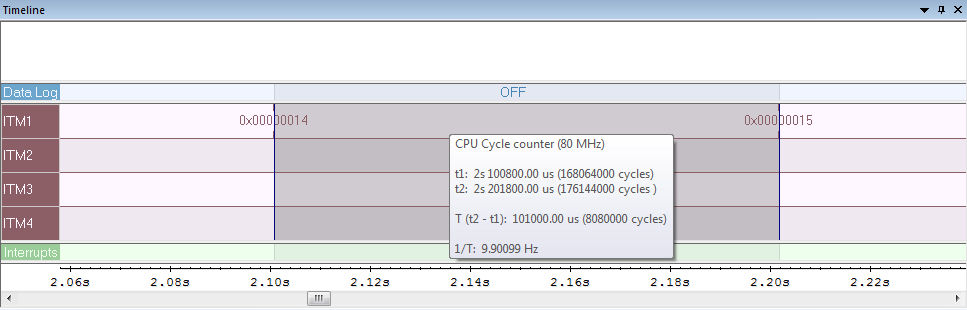
If you zoom in to see two adjacent messages, you will see that they are sent in 100 ms period, as we expected. You can measure the time on timeline, by marking the time period and just hover hover your mouse over this region.
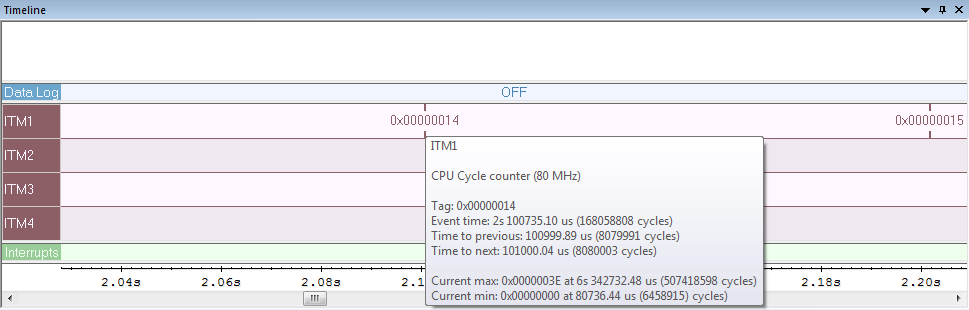
You can also hover your mouse over one of ITM messages, to see this kind of information:
Now let’s enable the Interrupts row (as we did on ITM channel). Again… If you do it during the program run, you need to pause and run it again. Now you should see something like this:
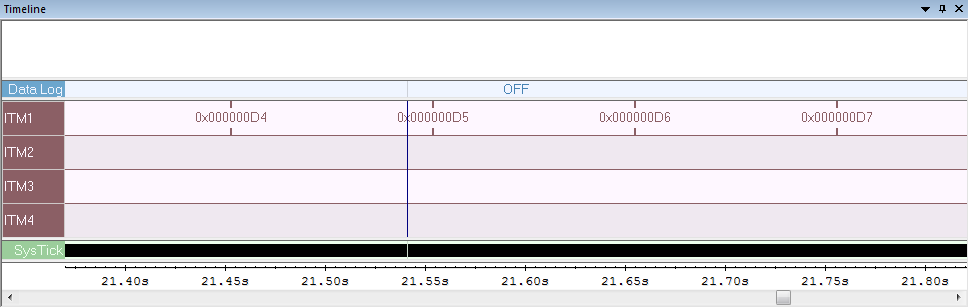
Now let’s zoom in to see what’s in the SysTick row.
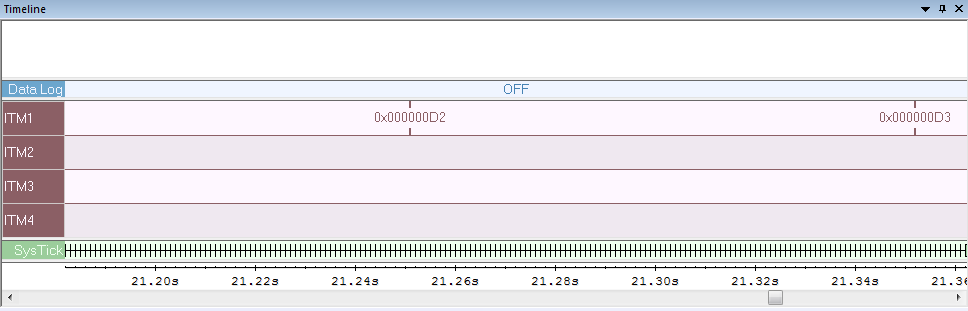
Yes, it’s exactly what you think! Every call to SysTick interrupt is marked here Actually all enabled interrupts will be here but right now we have only SysTick. But if we zoom in more (a lot more), it’s getting even more interesting.
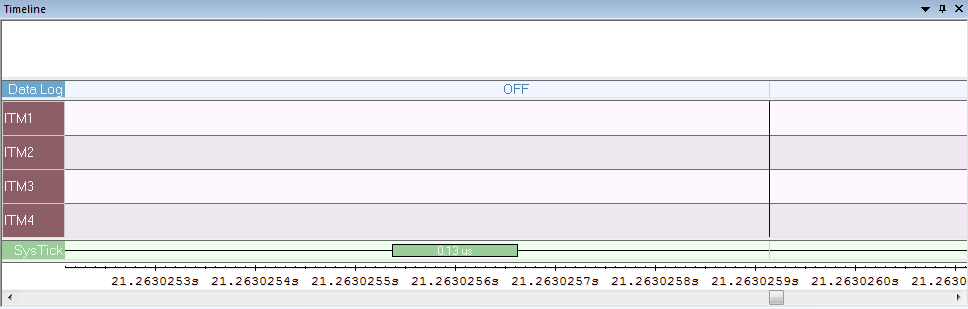
Entering and exiting from interrupt routine is marked on Timeline! As you can see, the executing SysTick routine takes 130 ns.
There’s just one row left on Timeline window: Data Log. But before we can use it, let’s modify code. To view data log we need some data to look at, so let’s create one variable in USER CODE PV block.
/* USER CODE BEGIN PV */
uint32_t data = 0;
/* USER CODE END PV */
Now we can modify our variable somewhere in while loop.
   /* USER CODE BEGIN WHILE */
   uint32_t i = 0;
   while (1)
   {
      /* USER CODE END WHILE */

      /* USER CODE BEGIN 3 */
      HAL_Delay(100);
      ITM_SendMsg(i);
      i++;
      if(i==33)
      {
         data = data  + 15;
      }
      if(i==50)
      {
         data = data + 12;
      }
   }
   /* USER CODE END 3 */
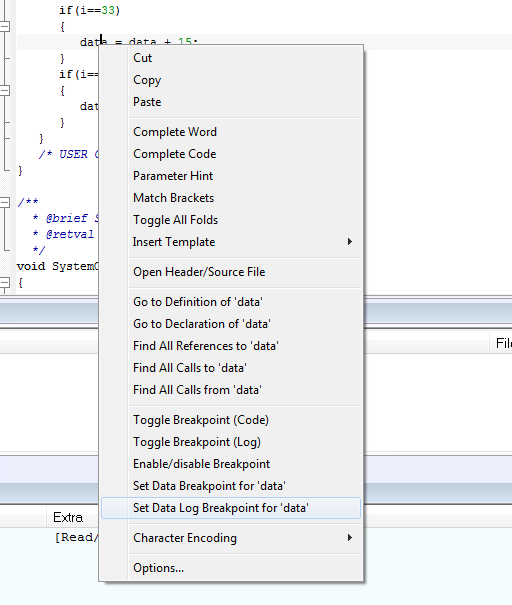
We want to track value of that variable in Timeline whenever it changes the value. Right click somewhere on that variable and select “Set Data Log Breakpoint for ‘data'”.
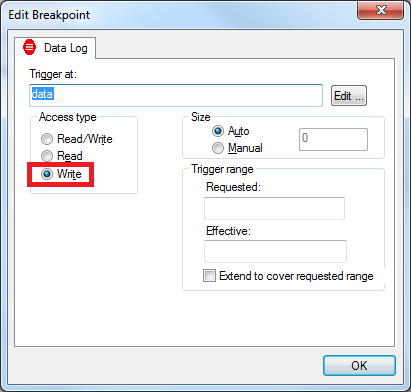
Now click menu View -> Breakpoints, and right click data and select Edit… menu. In window set Access Type to ‘write’, because we want to track whenever the value is written.
Now we can run again the program. Of course Enable Data Log in Timeline window (don’t forget to pause and run again).
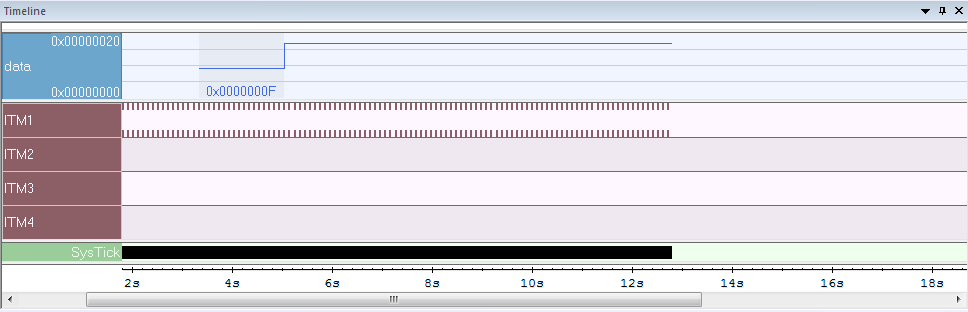
As you can see, whenever the value of ‘data’ variable is changed, we have it on Timeline.
OK, that’s all for now. I hope you get interested, because I’m planning to write something more about this feature.
All files used in this note are available here: